Industry Insights: Store Brands 3/1/2017
Did You Know?
In 2010, consumer reports found that store brand items were as good (or better) than their national brand counterpart. *Consumer Reports
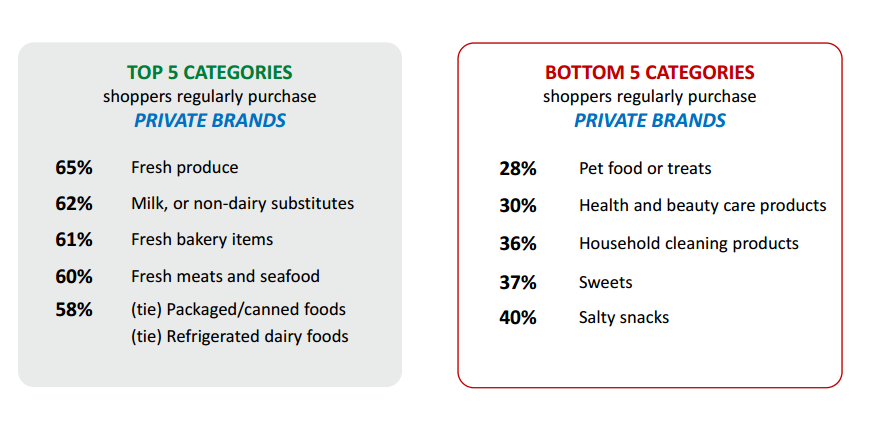
Percentage of name brand vs private label products can vary greatly. Consider this: In the U.S., only 2% of hair-care sales come from private-label brands while private label milk represents more than 40% + of total sales in developed markets. *Nielsen 2014
More than 50% of U.S. manufacturers of branded consumer packaged goods make private-label goods as well.
There are nearly 95 million U.S. consumers of private-label goods. *Statista 2014
Over the past 20 years, private-label market share has averaged 14% of U.S. dollar supermarket sales. In the depth of the 1981–1982 recession, it peaked at 17% of sales; in 1994, when private labels received great media attention, it was more than two percentage points lower at 14.8%. *hbr.org
For the 52-week period ending Dec. 24, 2016, retailers’ brands strongly outperformed the national brands. Private label dollar volume in the mass merchandiser/club/dollar store segment climbed 4.4 percent to $49.6 billion, resulting in a 0.5 point market share gain to 16.6 percent. *Nielsen 2017
Growth Trends & Opportunities
Private-label success is found in commodity driven, high-purchase categories and those where consumers perceive little differentiation. Further, private-label growth typically comes at the expense of small- and mid-sized brands, while brand-leaders remain competitive. *Nielsen 2014
Organic Options
Private label and organic options are a major area of growth. Retailers such as Target, Whole Foods and others all have extensive lines of store brand options. *Forbes.com
Drive Loyalty
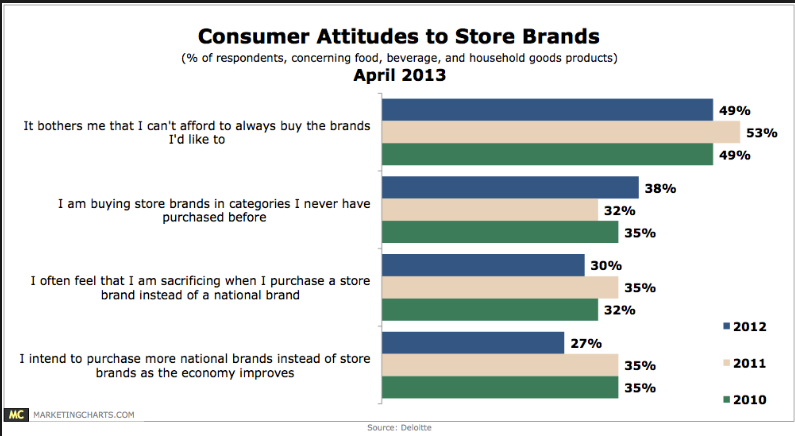
Much of the focus on store brands began during the recession following the housing bubble. Many consumers turned to store brands to save money. But studies suggest consumers will continue to be loyal to store brands even now that times have improved: 94% of North American respondents would continue to purchase private label brands even after the economy improves. *Statista 2015
Balancing Digital and Retail Presence
The U.S. has more retail square footage than any other country at 47 square feet of retail space per capita. However, retail store visits fell from 35 billion in 2009 to 17 billion in 2013. Given the massive reduction in store visits, you must recalibrate to create an optimal balance between physical and digital presence. *PWC 2016
Percentage of name brand vs private label products can vary greatly. Consider this: In the U.S., only 2% of hair-care sales come from private-label brands while private label milk represents more than 40% + of total sales in developed markets. *Nielsen 2014
More than 50% of U.S. manufacturers of branded consumer packaged goods make private-label goods as well.
There are nearly 95 million U.S. consumers of private-label goods. *Statista 2014
Over the past 20 years, private-label market share has averaged 14% of U.S. dollar supermarket sales. In the depth of the 1981–1982 recession, it peaked at 17% of sales; in 1994, when private labels received great media attention, it was more than two percentage points lower at 14.8%. *hbr.org
For the 52-week period ending Dec. 24, 2016, retailers’ brands strongly outperformed the national brands. Private label dollar volume in the mass merchandiser/club/dollar store segment climbed 4.4 percent to $49.6 billion, resulting in a 0.5 point market share gain to 16.6 percent. *Nielsen 2017
Growth Trends & Opportunities
Private-label success is found in commodity driven, high-purchase categories and those where consumers perceive little differentiation. Further, private-label growth typically comes at the expense of small- and mid-sized brands, while brand-leaders remain competitive. *Nielsen 2014
Organic Options
Private label and organic options are a major area of growth. Retailers such as Target, Whole Foods and others all have extensive lines of store brand options. *Forbes.com
Drive Loyalty
Much of the focus on store brands began during the recession following the housing bubble. Many consumers turned to store brands to save money. But studies suggest consumers will continue to be loyal to store brands even now that times have improved: 94% of North American respondents would continue to purchase private label brands even after the economy improves. *Statista 2015
Combat Decision Fatigue
Some retailers, such as Trader Joe’s, offer a large proportion of private label options. This can enhance brand and customer loyalty because of a psychological phenomenon called decision fatigue. Essentially, humans are only able to make a set number of decisions before we become stressed and frustrated. Shoppers report more satisfaction with places with fewer options. Store brand emphasis solves this consumer frustration. *Fastcompany.com
Balancing Digital and Retail Presence
The U.S. has more retail square footage than any other country at 47 square feet of retail space per capita. However, retail store visits fell from 35 billion in 2009 to 17 billion in 2013. Given the massive reduction in store visits, you must recalibrate to create an optimal balance between physical and digital presence. *PWC 2016
Top and bottom categories where consumers typically purchase private brand items. *FMI.org 2016
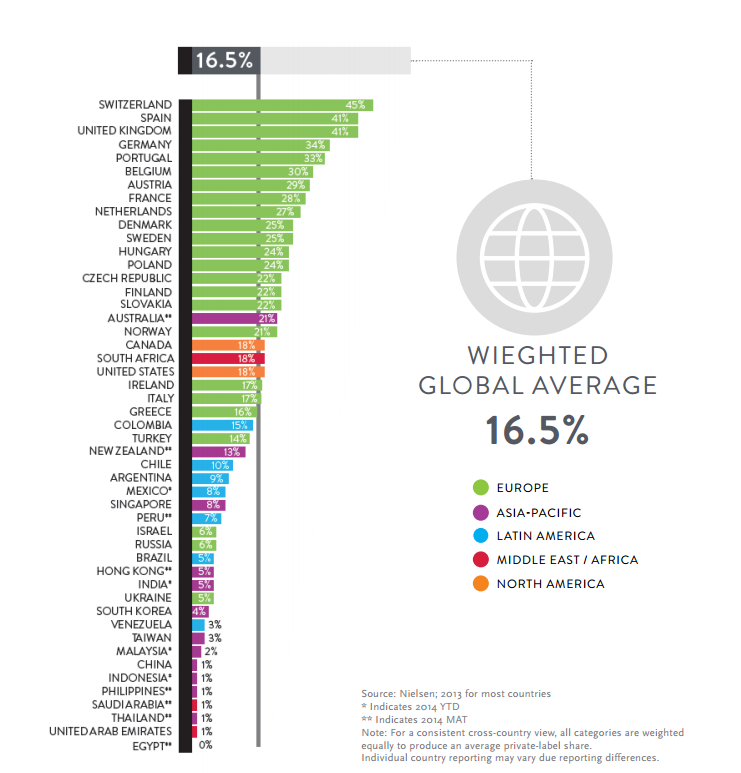
Average private label share by country. *Nielsen 2013
How consumers feel about store brands. *Deloitte